The "Bullwhip" (Supply Chain Impact)
A single typo in your catalog is a flick of a bullwhip. By the time it hits your warehouse, it's a crack that breaks your budget.
If you work in aftermarket auto parts, you already know the bullwhip effect from supply chain management textbooks. Small demand fluctuations at the retail level get amplified into wild swings at the distributor and manufacturer level. Overstocking. Emergency orders. Warehouses packed to the ceiling with parts that nobody asked for.
But here's what most people miss: the same amplification dynamic plays out with data. And it starts far earlier than anyone expects. Right at the catalog level, in your product feed, where one wrong word, one missing attribute, or one mismatched fitment entry sets off a chain reaction that ends with real dollars evaporating from your P&L.
The Data Bullwhip: How It Actually Unfolds
Let's walk through a real-world scenario. It happens every day in auto parts e-commerce, and almost nobody traces the problem back to its origin.
Step 1: The Flick. A Missing or Wrong Attribute.
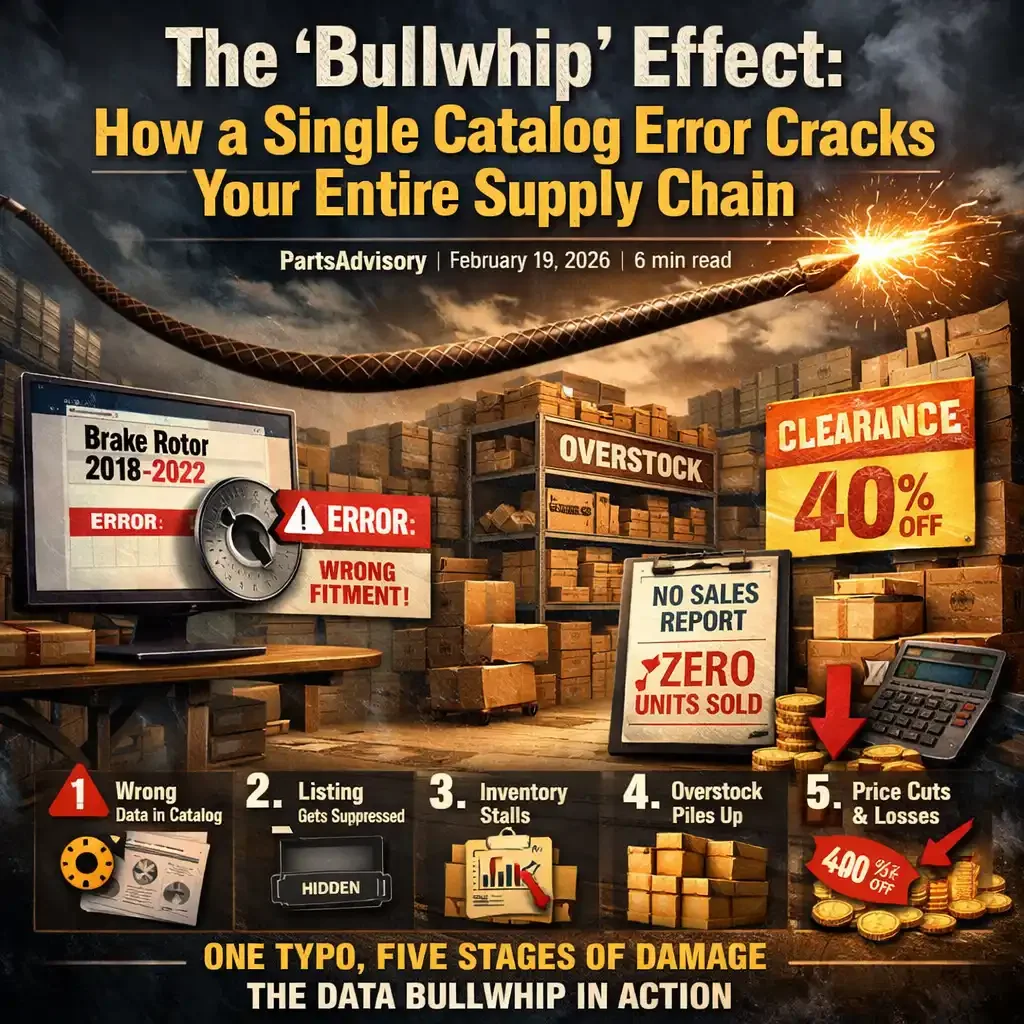
A brake rotor listing is missing its "drilled and slotted" attribute. Or a headlight assembly has the wrong OE interchange number. Or the fitment data says "2018 to 2022" when it should say "2018 to 2023." It seems minor. It is not.
Step 2: The Ripple. The Listing Goes Dark.
The marketplace's fitment filter drops the part from search results for the 2023 model year. Or the listing is suppressed because the product type attribute doesn't match the catalog standard. Customers searching for that exact part are now finding your competitor instead. You don't get a notification. You just stop getting sales.
Step 3: The Wave. The "No-Sale" Report.
Two weeks pass. The inventory team runs their sell-through report. That brake rotor? Zero units moved. It gets flagged as a slow mover. Nobody on the inventory team knows the listing was suppressed. They just see a part that isn't selling. The system is working exactly as designed. It's the input that's broken.
Step 4: The Swell. The Overstock Decision.
The purchasing team looks at the slow-mover report and reduces the reorder quantity, or flags the SKU for clearance. Meanwhile, 200 units are sitting in the warehouse, occupying shelf space, accruing carrying costs. The part just got promoted from "slow mover" to "dead stock."
Step 5: The Crack. Margin Destruction.
The markdown hits. The price gets slashed 30 to 40% to clear the inventory. Advertising spend gets re-allocated away from the SKU. A part that had healthy margin is now being liquidated at a loss. Not because the market didn't want it, but because the market couldn't find it.

One wrong attribute. Five stages of amplification. The distance between "typo" and "liquidation" is shorter than you think.
Why Nobody Catches It
The insidious thing about the data bullwhip is that each team along the chain is making a perfectly rational decision based on the information they have. The inventory analyst sees a part that doesn't sell, so they mark it down. The purchasing manager sees dead stock, so they stop reordering. The finance team sees margin erosion, so they question the product line.
Everyone is doing their job. The problem is that the original signal, the catalog error, is invisible to all of them. They're reacting to symptoms, and the root cause is buried in a spreadsheet that nobody in operations ever looks at.
This is exactly how the bullwhip effect works in traditional supply chain theory: each node responds rationally to local information, but those rational local decisions compound into irrational global outcomes.
Your overstock report isn't a demand problem. It's a data problem wearing a demand costume.
The Math That Should Keep You Up at Night
Let's put rough numbers on it. Say you have 15,000 active SKUs. Industry benchmarks suggest that 5 to 15% of catalog listings in the aftermarket have at least one material data error. A wrong fitment year, a missing attribute, an incorrect product type code.
At the conservative end, that's 750 SKUs with compromised listings. If each of those SKUs carries $40 in average inventory value and you're eventually forced to liquidate even half of them at a 35% discount, you're looking at roughly $5,250 in pure margin destruction, per cycle. And that's before you factor in the carrying costs, the wasted warehouse space, the lost ad spend on products that never had a chance, and the opportunity cost of not selling those units at full price when the demand was there.
Scale that to 50,000 SKUs at a mid-size distributor and the numbers get ugly fast.
The "So What": Fix It Where It's Cheapest
Here's the thing about a bullwhip: the further you are from the handle, the more violent the movement gets. The same is true for data errors in your supply chain.
Fixing a catalog attribute in your product feed costs almost nothing. It's a cell in a spreadsheet. A field in your PIM. A line in your ACES file. It takes minutes.
Fixing the consequences of that catalog error (the overstock, the markdowns, the liquidation, the re-forecasting, the warehouse reshuffling) costs thousands. Sometimes tens of thousands. And those costs are recurring, because if you don't fix the root cause, the next batch of inventory will follow the same path.
The cheapest place to fix a supply chain problem is in the product feed, not on the warehouse floor. The most expensive place to discover a data problem is in your overstock report.
Where to Start
Pull your overstock and dead-stock report. Now pull the catalog listings for those same SKUs. Check the fitment data against the actual vehicle applications. Check the product attributes against the marketplace requirements. Check the titles and descriptions for missing specs.
I'll bet you 20% of those "dead" SKUs aren't actually dead. They're misunderstood. The market wanted them, but the catalog told the market they didn't exist.
How to Break the Data Bullwhip
To break the data bullwhip, you must move from reactive inventory management to proactive data auditing. Here are the specific steps and tools recommended to stop catalog errors from destroying your margins.
1. Conduct a "15-Minute" Audit
Before a full overhaul, use a high-impact spot check to identify immediate gaps.
Coverage Check: Compare active SKUs against what should be listed. Ensure discontinued parts are removed and new ones are mapped.
Fitment Scan: Verify that Year-Make-Model (YMM) details are complete and mapped to current ACES/PIES standards.
Attribute Validation: Check for missing MPNs (Manufacturer Part Numbers), interchange/cross-reference numbers, and required weights/dimensions.
2. Cross-Reference "Dead" Stock with Fitment Data
Your overstock report is your best diagnostic tool.
Action: Take your top 20% of non-moving SKUs and manually check their Amazon Confirmed Fit or marketplace status.
Goal: Determine if the part isn't selling because there is no demand, or because a data gap made it invisible to search filters.
3. Deploy Specialized Automotive PIM Software
Generic spreadsheets are the primary cause of the data bullwhip. Specialized Product Information Management (PIM) systems for the aftermarket automate validation and syndication.
Epicor PIM: Feature-rich system designed for manufacturers and retailers to aggregate and publish PIES-compliant data.
PDM Automotive: A centralized platform for high-quality data authoring and distribution specifically for the aftermarket.
DRIVE: Centralizes complex parts data and ensures compliance with ACES/PIES for various sales channels.
4. Implement Regular "Cycle Counts" for Data
Just as you count physical inventory, you must count your data accuracy.
Frequency: Perform small, frequent "blind counts" of data attributes rather than one massive annual audit.
Segregation of Duties: Have a different team than the one that created the catalog perform the audit to ensure objective oversight.
5. Leverage Visual Tools to Reduce Returns
Incorrect fitment data often results in high return rates, further cracking the bullwhip.
Visual Search: Diagrams provide interactive full-vehicle diagrams to help buyers identify the exact part needed.
360-Degree Views: High-resolution rotational images can reduce returns by allowing customers to visually verify the part against the one they are replacing.
Your Overstock Report Is Trying to Tell You Something
Check your overstock report today. Cross-reference it with your catalog data. I'd bet that at least 20% of those "dead" SKUs are actually just "misunderstood" data, parts with real demand that your customers simply couldn't find. The fix isn't a markdown. It's an audit.
PartsAdvisory helps aftermarket auto parts companies clean up their catalog data, fix fitment errors, and stop bleeding margin from preventable supply chain problems. Based in Los Angeles, CA.